The parts of my work that sit between disciplines: a Blender tool that audits and exports an asset, a Blueprint base class the whole level inherits from, and a profiling pass that told me something I did not want to hear. Every number on this page was measured, not estimated.
I was checking 41 meshes by hand before every export of the A320 nose gear: scale applied, UVs present, material assigned, texel density near target. It is slow, and a missed check only shows up once the asset is already in Unreal at the wrong size. So I wrote a script to do the pass in one go.
It reports every mesh with modifiers applied, writes the result to CSV, and optionally exports each mesh to FBX while recording the exact export settings used, so the handover document can quote them instead of guessing.
Thirty seven of the 41 meshes came back with something flagged. Most of it was advisory: texel density between 124% and 160% of the median, which is expected, because Average Islands Scale evens density inside a texture set and not between sets. The ngon counts looked cosmetic too. They were not.
Warning: Mesh 'Cylinder.004' has polygons with more than 4 vertices, cannot compute/export tangent space for it
That warning appeared 29 times in a single export run, and the export still reported success, so nothing in the pipeline flagged it.
Why it matters. A normal map is not absolute: every pixel is a direction expressed relative to the tangent basis of the surface it sits on. Bake the map against one basis and read it against another and the lighting is subtly wrong. When the FBX carries no tangents, Unreal computes its own at import, and where those differ from the basis Substance baked against you get shading that does not match what you authored: seams along UV splits, bevel highlights that catch the light at the wrong angle, and flat panels that read as faintly warped under a moving light. On a mechanical asset whose entire value is crisp chamfers and panel detail, that is the difference between reading as machined metal and reading as a soft approximation of it.
It is also the kind of fault that survives review, because a static screenshot at the right angle looks fine. It shows up when the light moves.
The fix was to triangulate at export, which is where I want it to happen rather than silently on import. Same 41 meshes, same script, one setting changed:
| Export run | Meshes exported | Tangent space warnings |
|---|---|---|
| Before, as previously configured | 41 | 29 |
| After, triangulating on export | 41 | 0 |
The first version blocked any mesh with any issue from exporting, which would have let through only 4 of 41. That is a tool people switch off in a week. It now separates blocking problems, which are scale not applied, a missing UV map, a missing material and a LOD that fails to drop in triangles, from advisory ones such as ngons and texel variation. Advisory meshes export, and the export record lists them by name, so the next person sees what was known at the time rather than finding it later.
The script also closed two open items in the gear's handover document: it produced the first measured px/cm figure for the asset, where the document previously stated that density was enforced by method but never measured, and it generated the export settings record that was the last outstanding item before release.
Chasing the tangent warnings turned up a second problem. The exporter names the mesh datablock, not the object, so the log said Cylinder.004 when the part at fault was Trunnion_Boss. Twenty nine warnings, and no way to tell which meshes they belonged to without opening each one.
So I wrote a check for it: compare every object's name against its mesh data name and flag the mismatch, naming the offender in the report. It came back 41 of 41. Every mesh in the asset still carried the name Blender gave it at creation, while the objects on top of them had been named properly all along.
I made it advisory rather than blocking, because a name mismatch breaks nothing at runtime. It costs you exactly once: when something else goes wrong and the error points at a name you cannot place, which is what had just happened to me.
Read the script and the audit output on GitHub →
Drafted with an AI coding assistant, then tested, run on a 41 mesh production asset and extended by me. The mesh data name check is mine, and the blocking versus advisory split and the triangulation fix both came out of running the tool on real files.
For the airport baggage cart I extended the same audit tool with seven vehicle checks. They verify, before export, that the vehicle will rig and animate correctly: pivots, hierarchy and wheel geometry.
| # | Check | Passes when | Type |
|---|---|---|---|
| 1 | Wheel pivot centred | Origin within 0.1 cm of the wheel's own centre | Blocking |
| 2 | Spin axes agree | All four wheels spin around the same local axis | Blocking |
| 3 | Hierarchy correct | Front wheels and drawbar under FrontAxle, everything else under the root | Blocking |
| 4 | Rotation applied | No leftover rotation at rest | Blocking |
| 5 | Wheel size matches the real tyre | Diameter 46 cm, within 1 cm | Advisory |
| 6 | Triangle share | No single mesh over 25% of the asset's triangles | Advisory |
| 7 | Left and right wheels match | Same diameter, height and distance from the centreline, within 0.1 cm | Blocking |
I made a broken copy of the cart with one fault planted for each check. Every check caught the fault planted for it. All settings sit at the top of the script, so the same checks work on any vehicle, not just this cart.
My first audit run on the cart put the drawbar at 21,300 triangles, 65% of the whole asset, from the default torus resolution on the spring coils. I fixed it by hand, bringing it to 4,564 and the cart from 32.6k to 15.9k, then wrote the check so the tool catches that kind of problem for anyone.
On the finished cart the audit reports no blocking issues on any of the nine meshes; the drawbar's 29% share stays as an advisory, by choice.
The cart also found a bug in the tool: texel density came out about 100 times too low, because the script assumed one Blender unit is a metre and the cart works in centimetres. The fix converts the measured area using the scene's unit scale. The texel target is also the median of all meshes, and the triangle share is relative to the asset, so one heavy mesh can hide another. Fixed targets are planned for v1.2, along with a material check: a wheel assigned the wrong material got through on the cart.
Vehicle readiness check: checks 1 to 6 typed by me with step-by-step guidance from an AI assistant; check 7 written independently. Tested on my own production file and on deliberately broken copies.
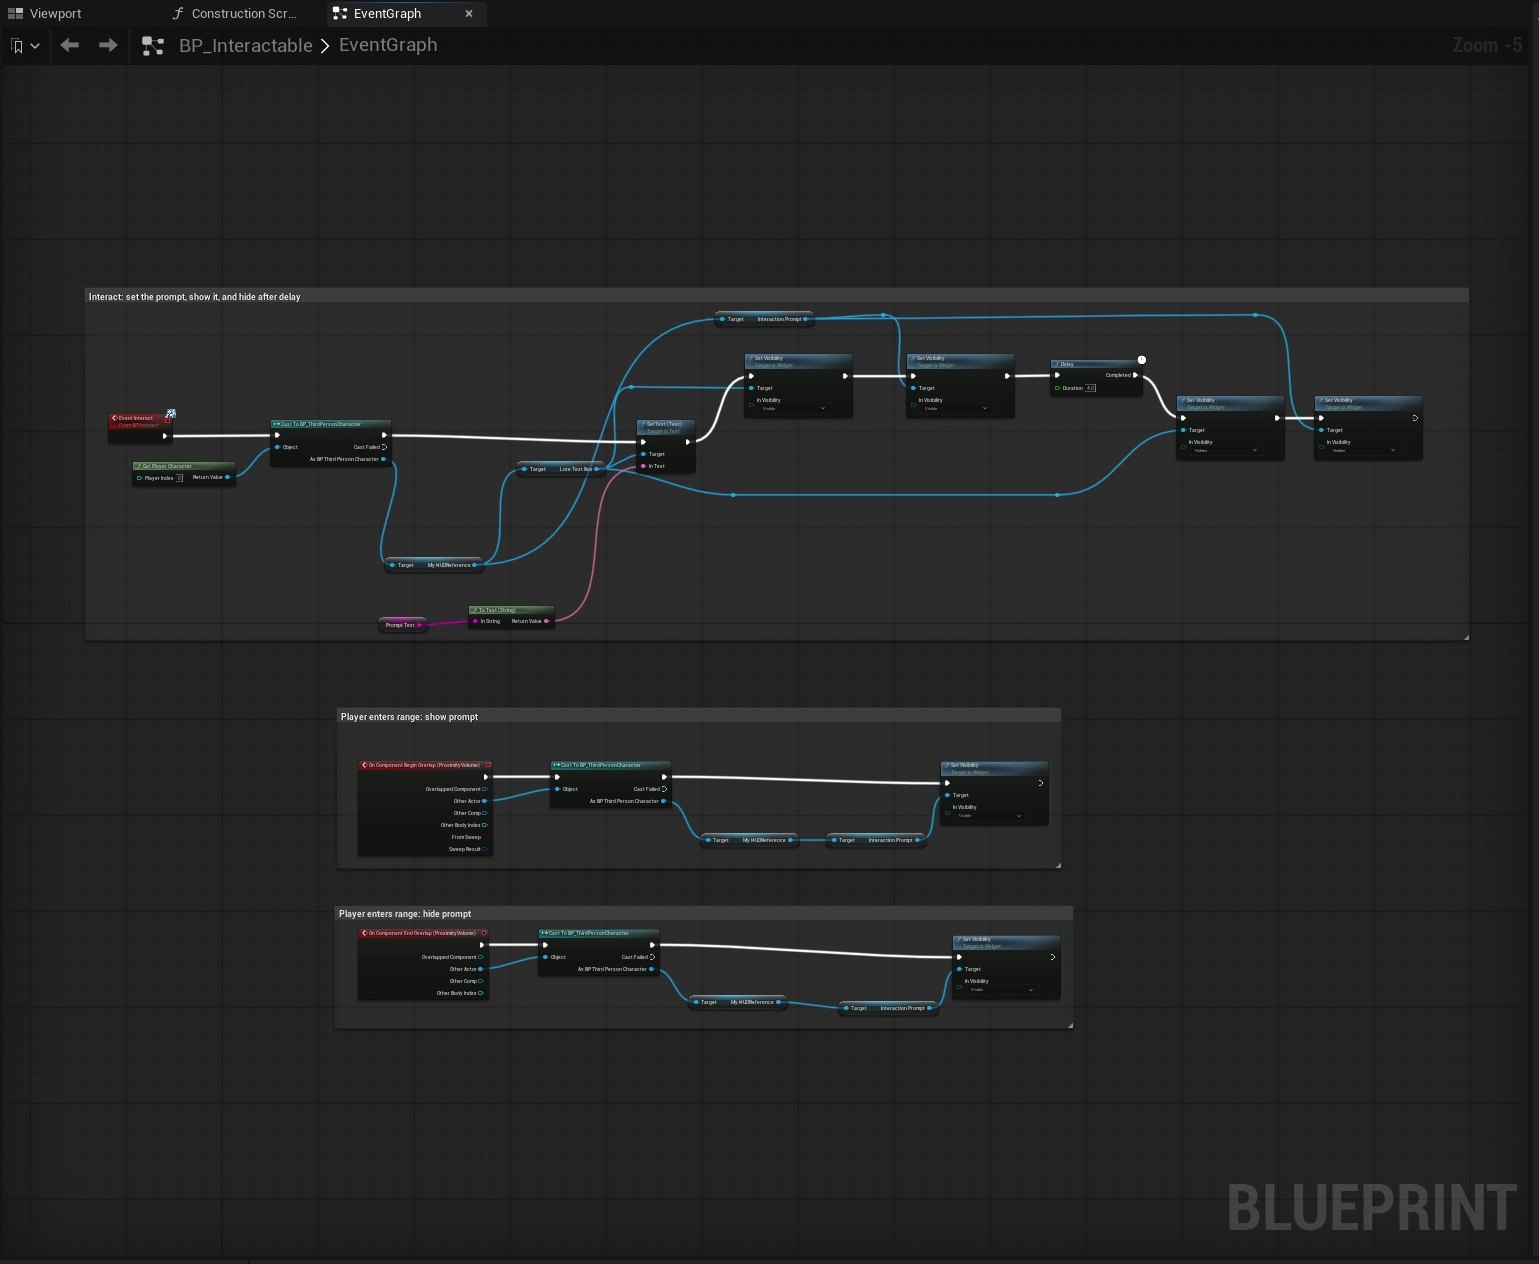
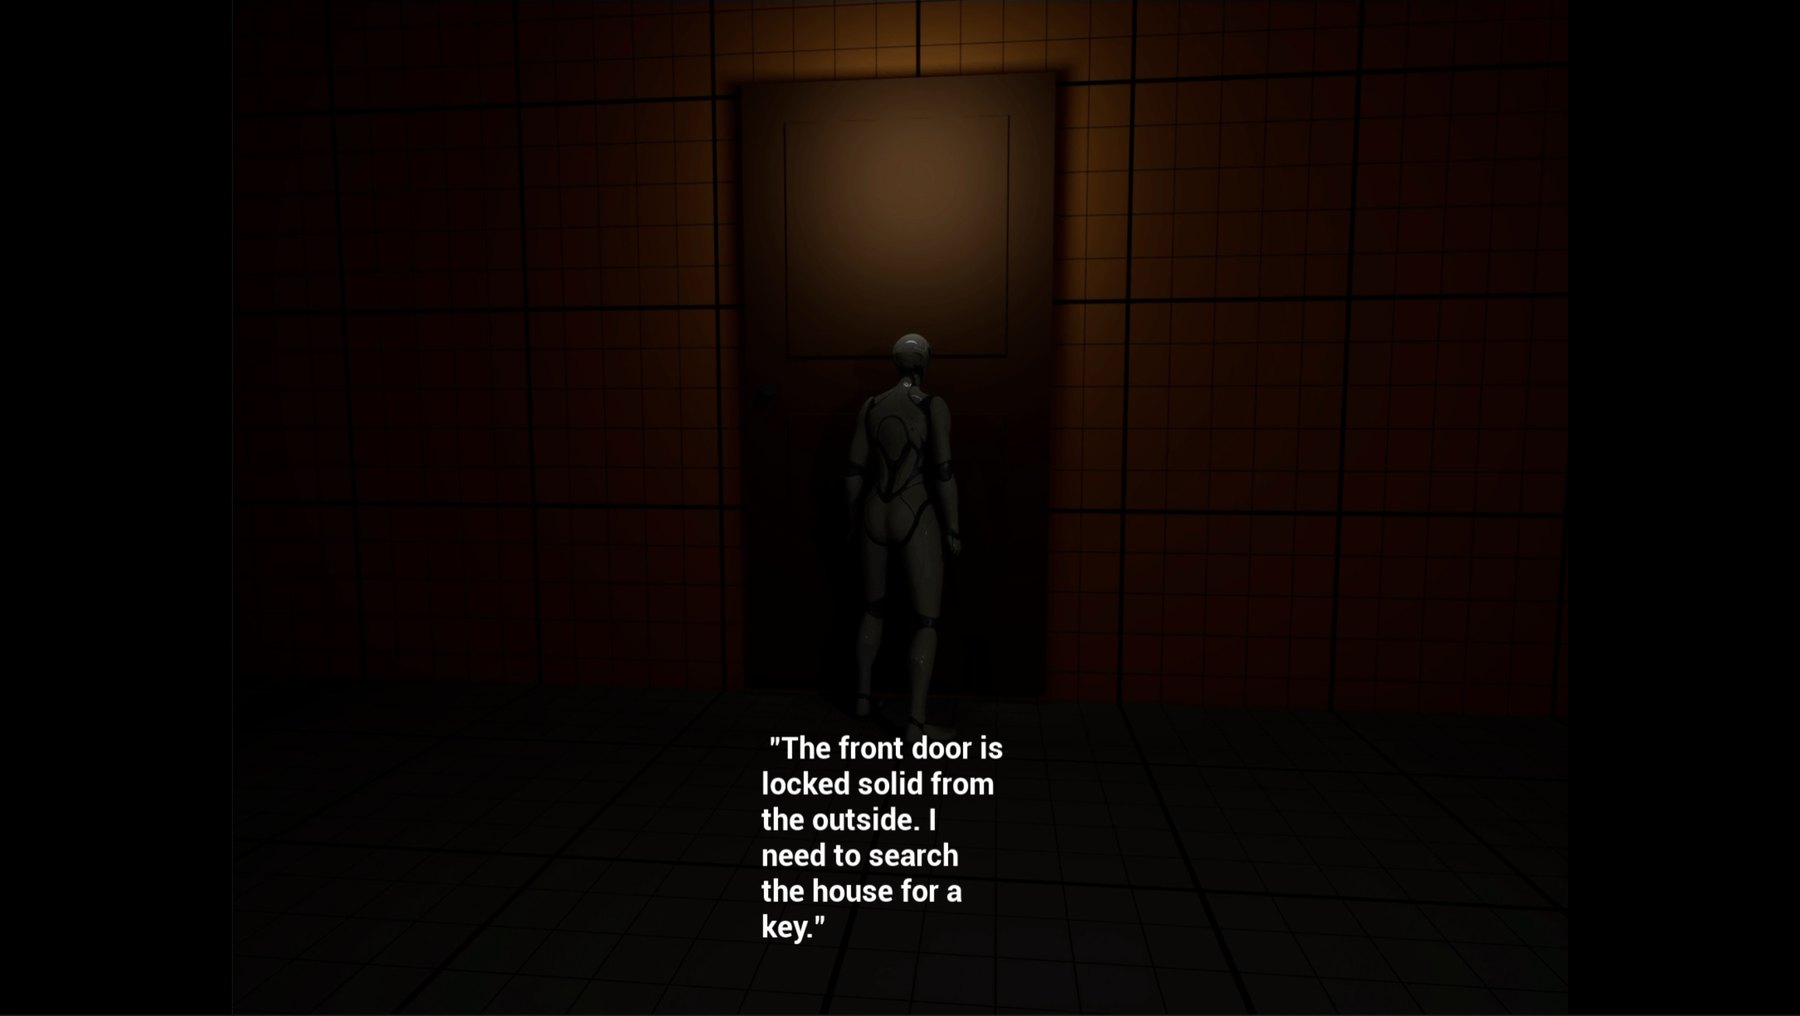
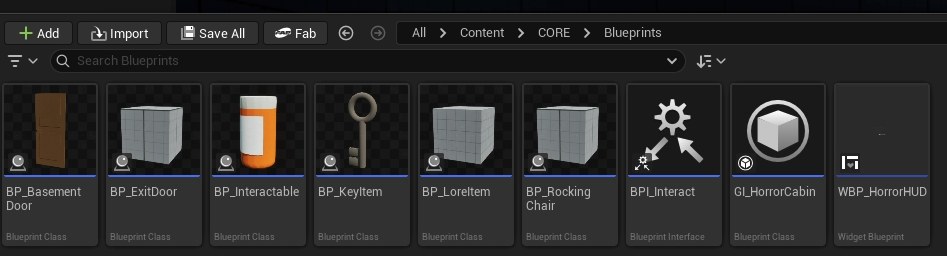
Every object the player can touch in 39 Days inherits from a single Blueprint. Rather than scripting the prompt, the proximity check and the widget handling separately on each object, the base class owns all of it and each child overrides only the part that differs.
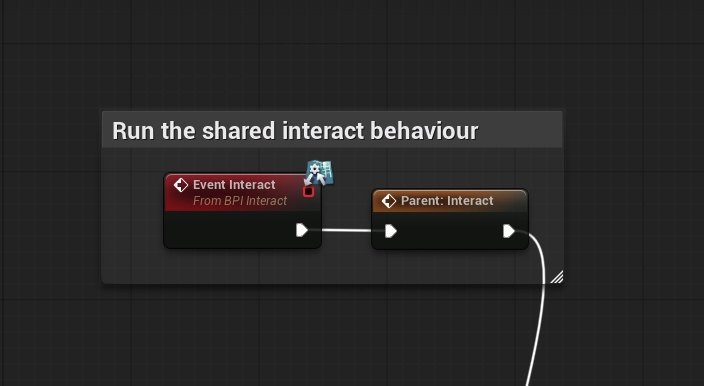
The interface sits alongside the base class rather than replacing it. Inheritance shares behaviour between objects that are the same kind of thing; the interface lets anything at all answer an interact call without being a child of that class. A child's override starts by calling straight back into the parent:
Adding a new interactable now means making a child, setting its prompt text and writing only its own behaviour. The cost of the sixth interactable is close to nothing.
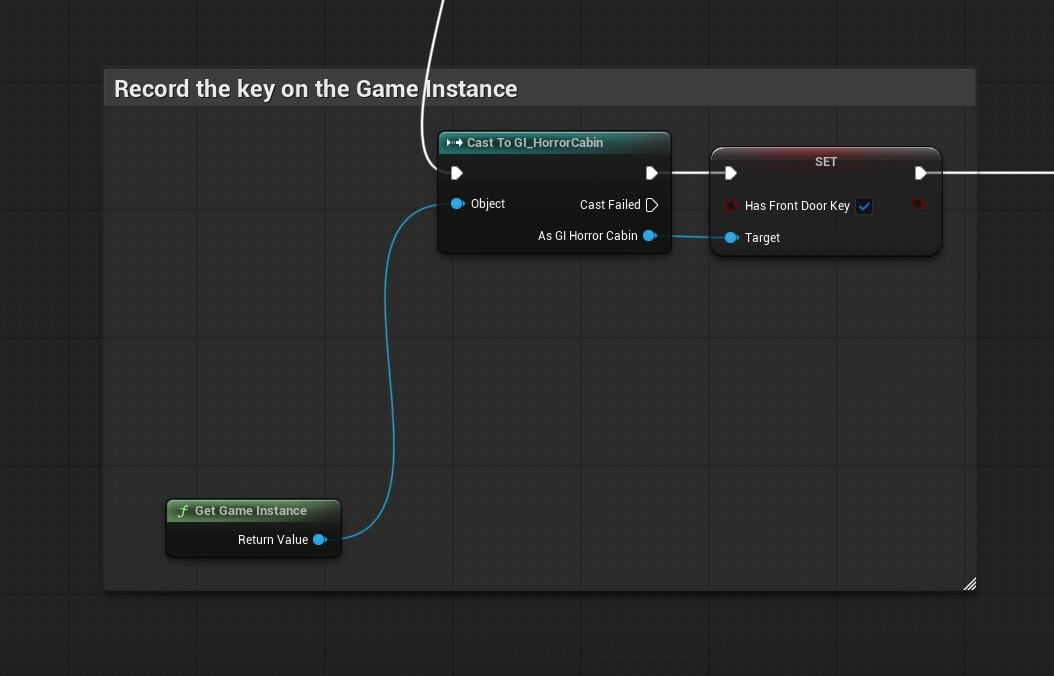
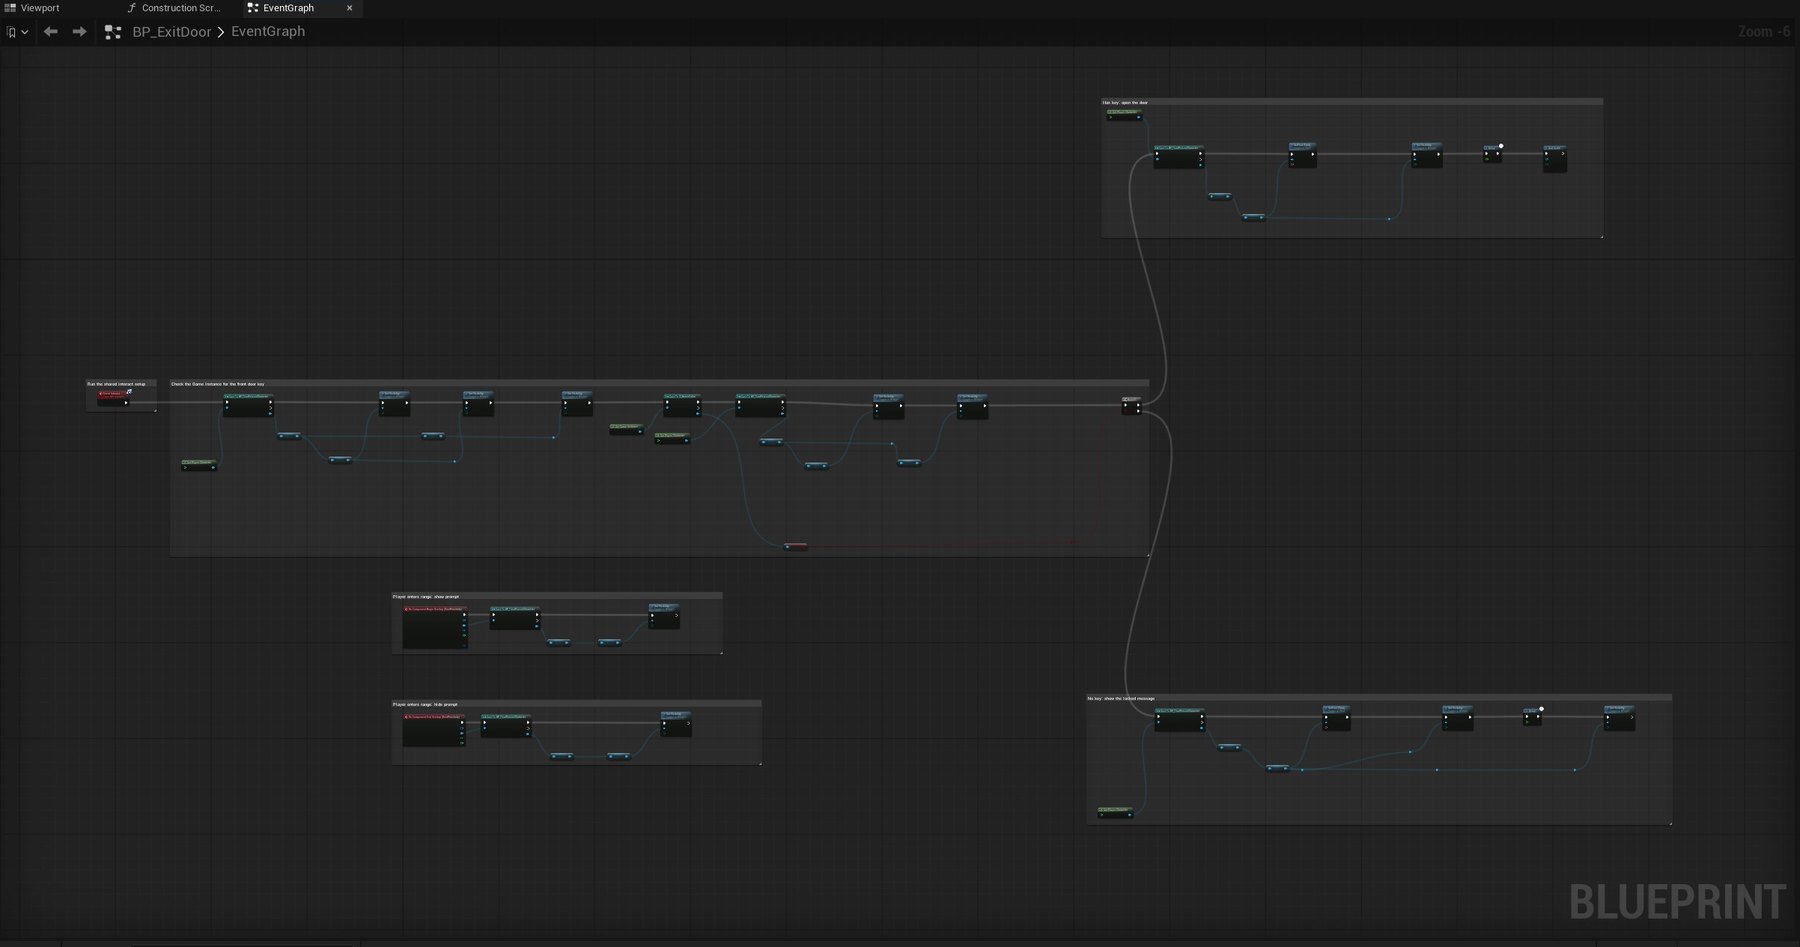
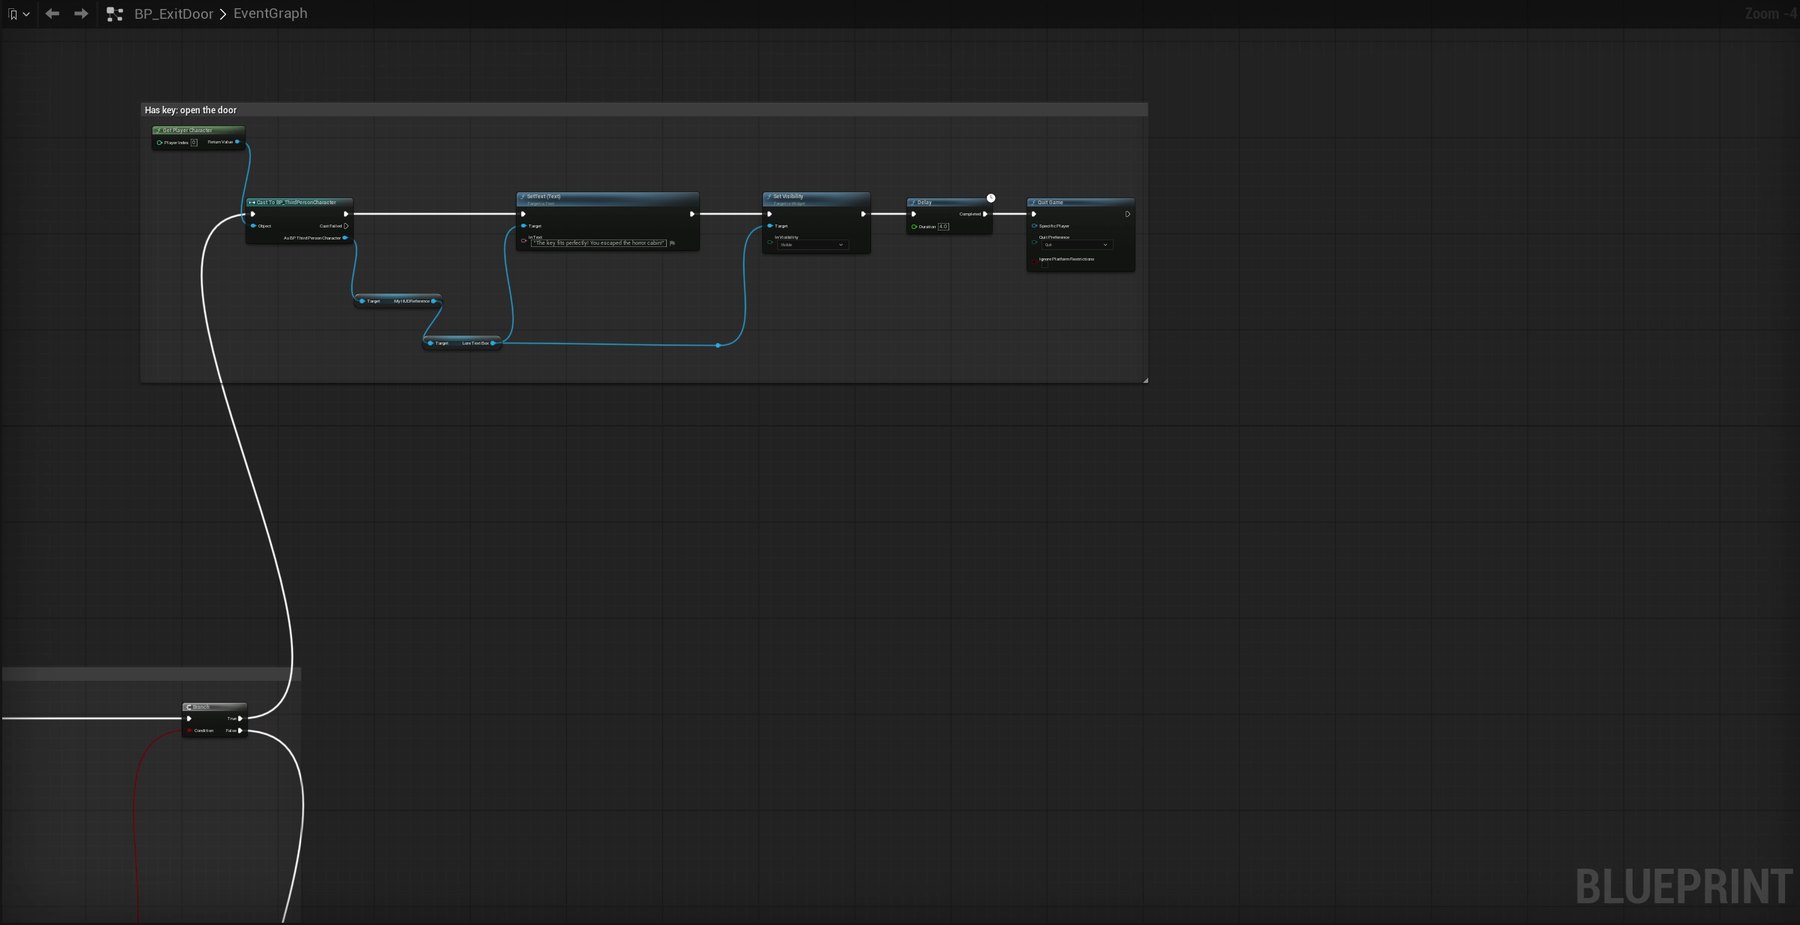
The key does not talk to the door. It writes a single boolean to the Game Instance, and the door reads it. Neither needs a reference to the other, so either can be moved, duplicated or deleted without breaking the other half.
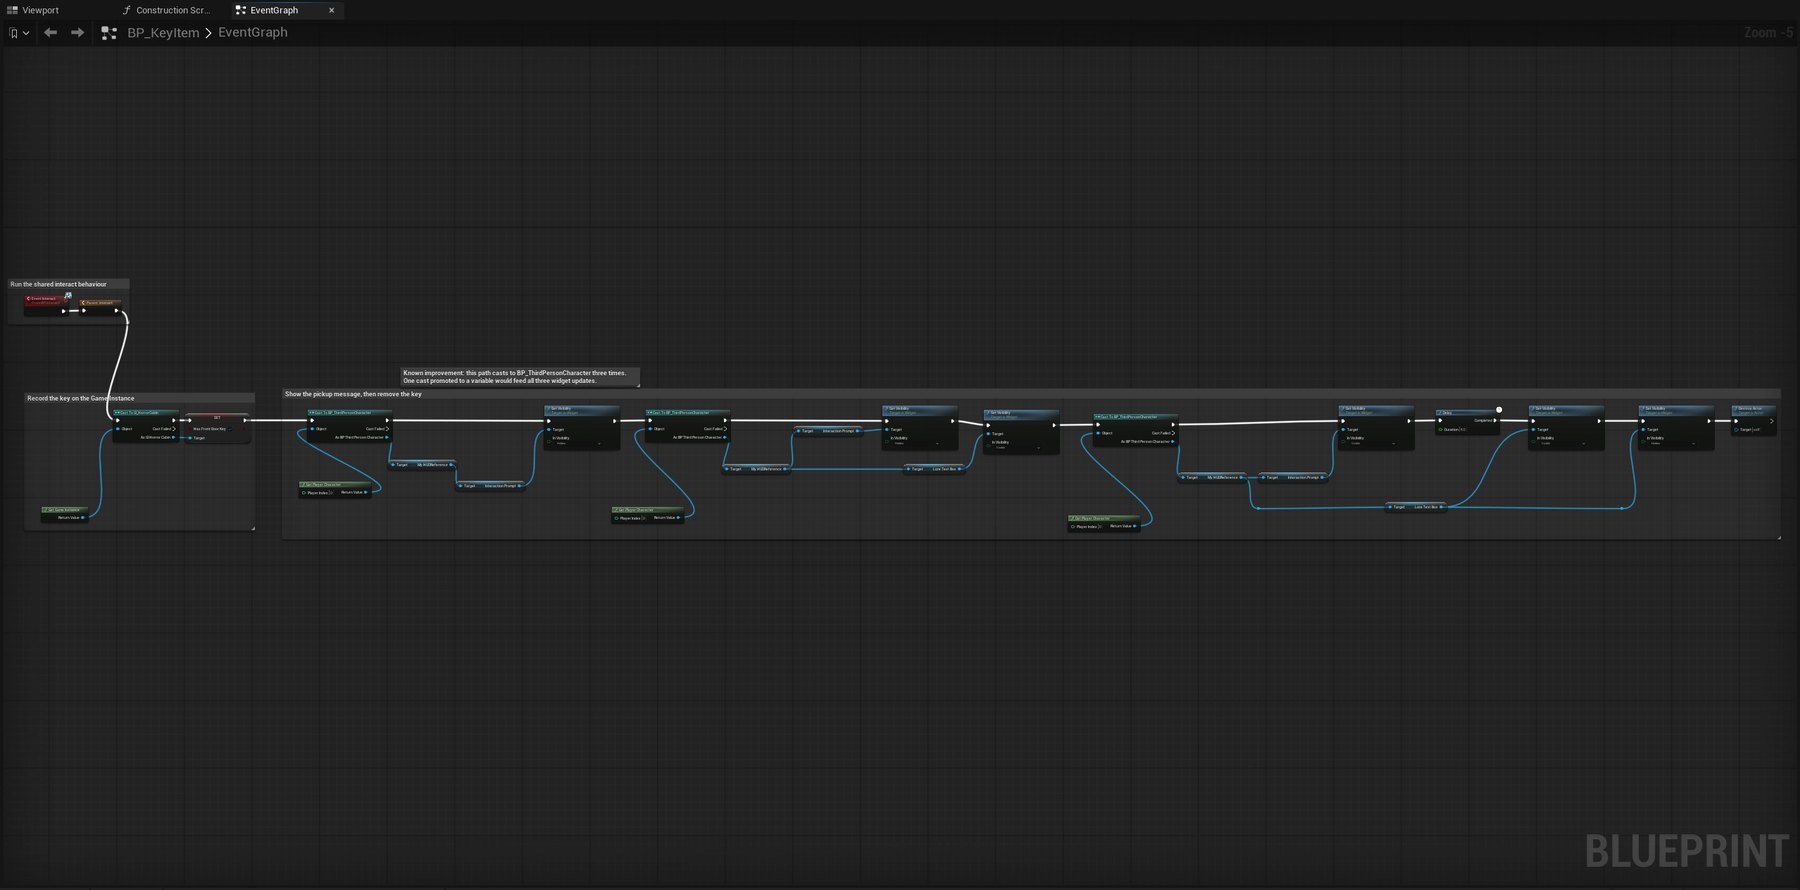
The pickup path casts to the player character three separate times to reach the same HUD widget. One cast promoted to a variable would feed all three updates. It is marked in the graph as a known improvement rather than quietly left there, because a comment that names the weakness is more useful to the next person than a tidy graph that hides it.
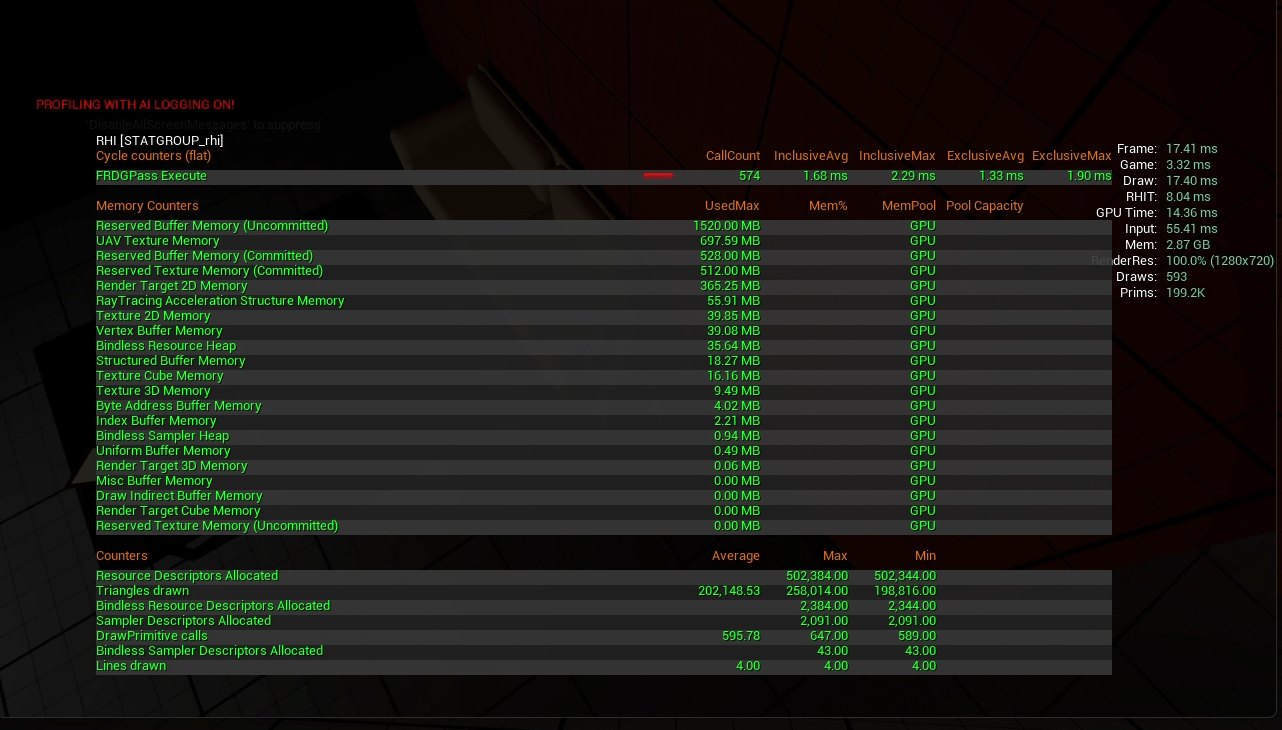
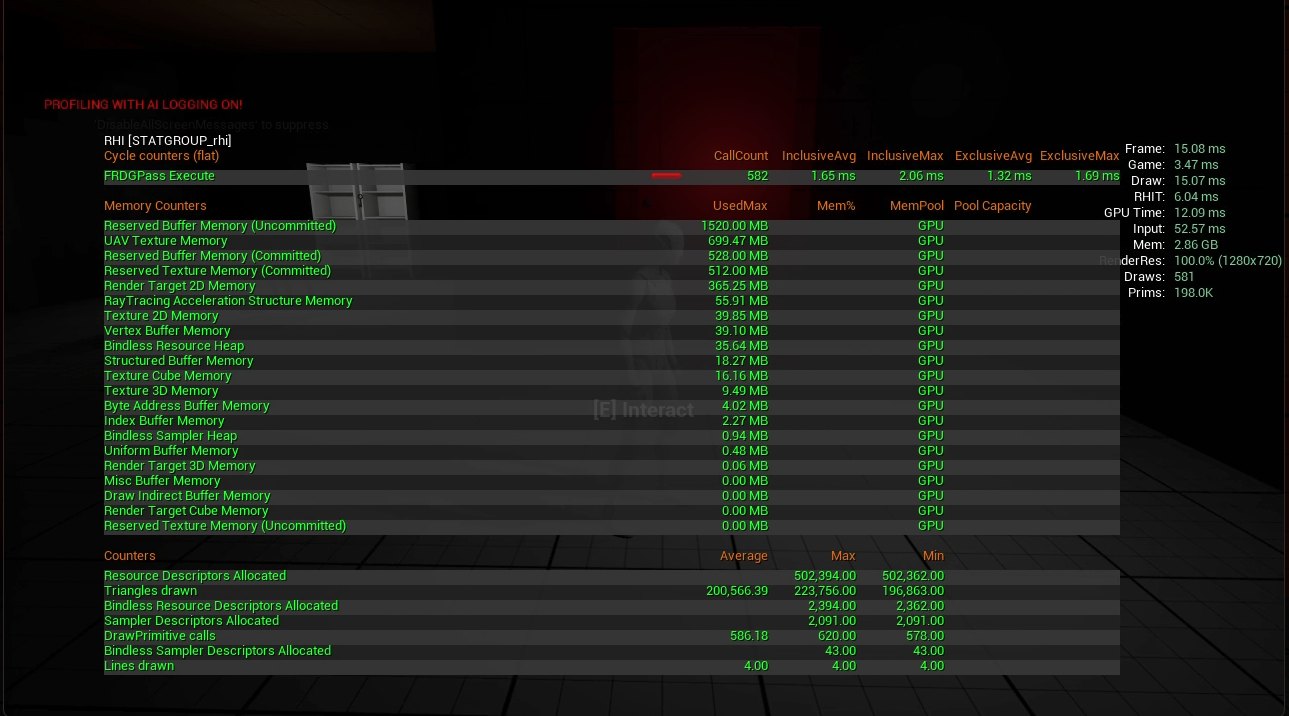
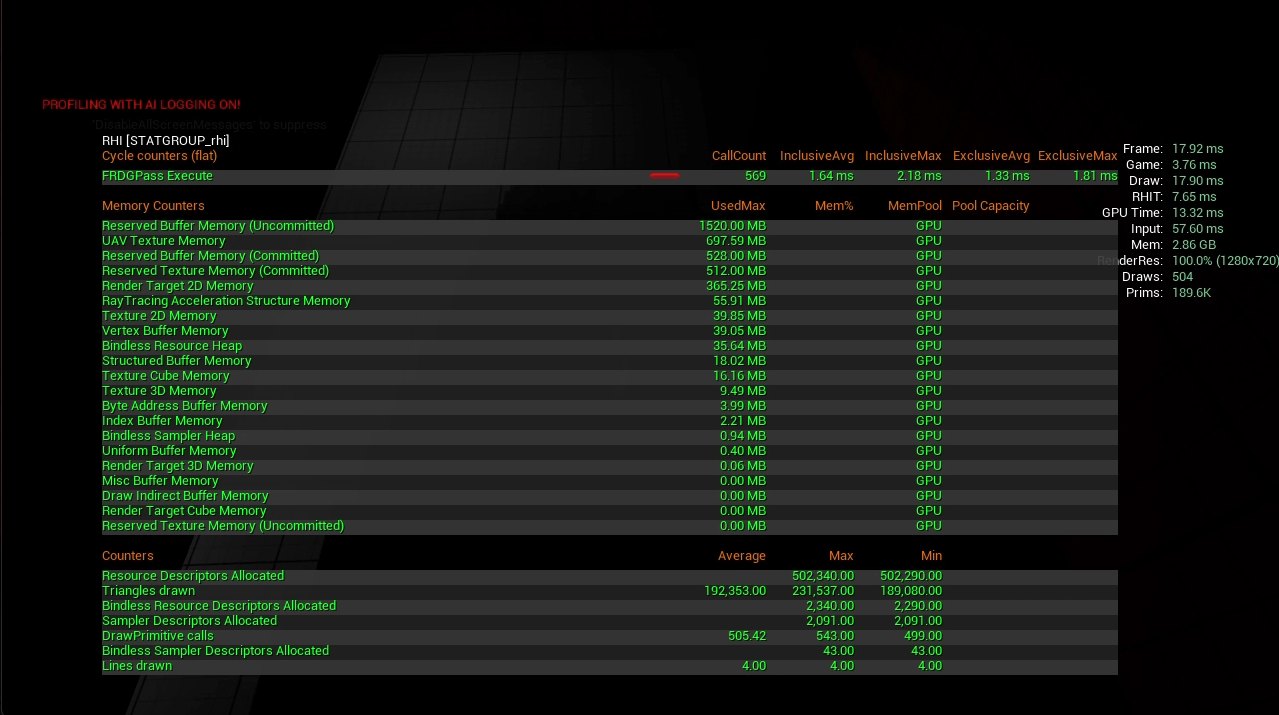
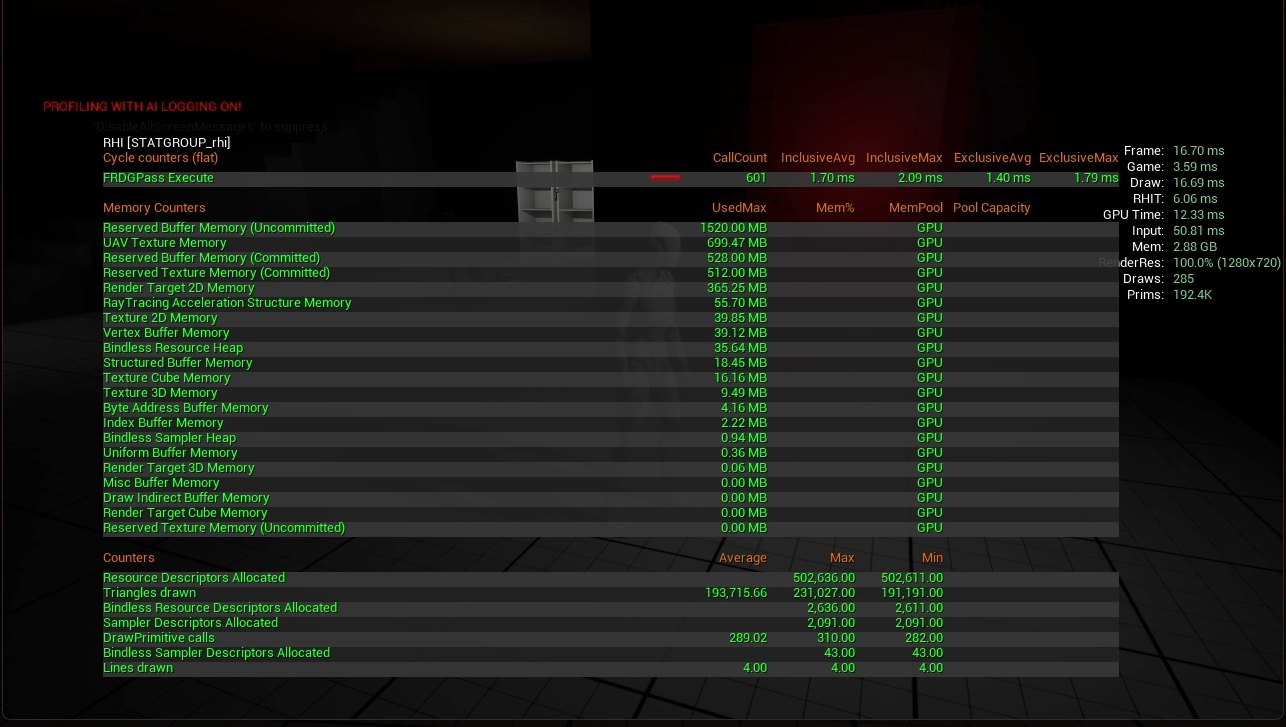
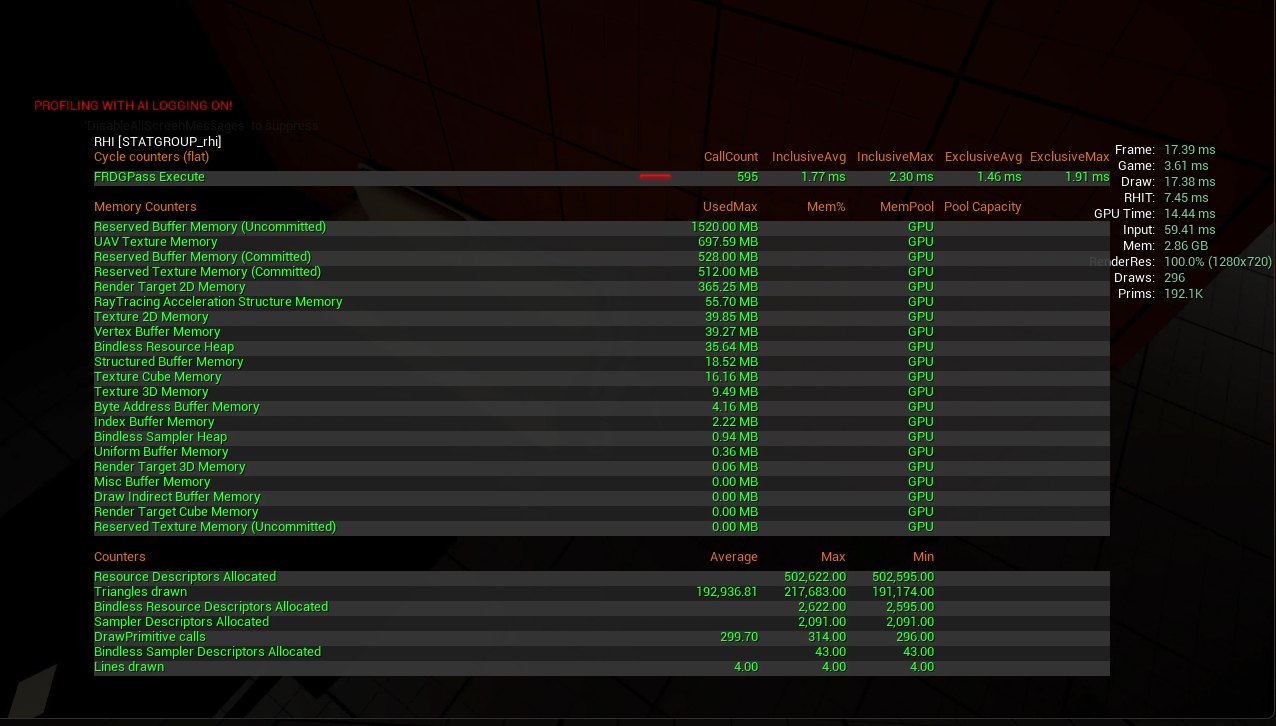
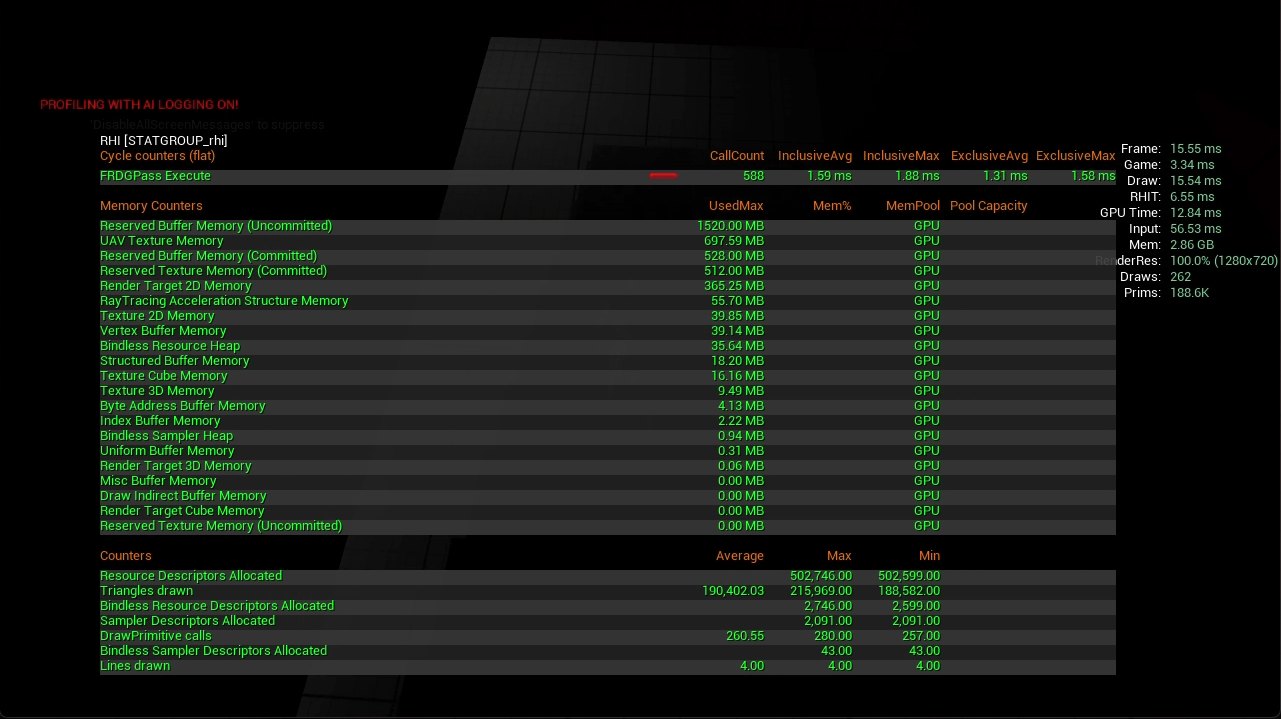
I believed 39 Days was render thread bound, and that draw calls were the thing to cut. Half of that turned out to be right. I measured it in a Standalone build, frame cap and vsync off, at three fixed positions, with stat unit and stat rhi on screen.
| Capture | Frame | Game | Draw | GPU |
|---|---|---|---|---|
| Hall, Nanite on | 17.41 ms | 3.32 | 17.40 | 14.36 |
| Stairwell, Nanite on | 15.08 ms | 3.47 | 15.07 | 12.09 |
| Basement, Nanite on | 17.92 ms | 3.76 | 17.90 | 13.32 |
| Hall, Nanite off | 16.70 ms | 3.59 | 16.69 | 12.33 |
| Stairwell, Nanite off | 17.39 ms | 3.61 | 17.38 | 14.44 |
| Basement, Nanite off | 15.55 ms | 3.34 | 15.54 | 12.84 |
Draw time and frame time agree to within 0.02 ms in all six captures, while the game thread never exceeds 3.76 ms. The render thread sets the frame, every time, in every room.


| Position | Draw calls, Nanite on | Draw calls, Nanite off | Frame on | Frame off |
|---|---|---|---|---|
| Hall | 593 | 285 | 17.41 ms | 16.70 ms |
| Stairwell | 581 | 296 | 15.08 ms | 17.39 ms |
| Basement | 504 | 262 | 17.92 ms | 15.55 ms |
Draw calls drop by roughly half with Nanite disabled, because its passes are no longer being submitted. Frame time does not follow. It goes down at one position, up at another and down at the third, by amounts smaller than the variation I see between two runs at the same spot.
So draw call count is not what is costing me here, and neither is Nanite. At roughly 700 triangles per mesh, Nanite's clustering has very little to work with, which is what I suspected, but removing it does not buy back frame time either. The render thread is spending its time on something else, and until I know what, cutting draw calls would be optimising the wrong number.
The honest answer is that this measurement tells me where the ceiling is, not what is holding it up. The next pass is Unreal Insights to see which render pass dominates the thread, and only then instancing or merging if the data supports it. I would rather publish a result that contradicts my own guess than run an optimisation that happens to look good.
Measured in a Standalone build with t.MaxFPS 0 and r.VSync 0 at 1280 x 720, Nanite disabled with r.Nanite 0 rather than per asset, so meshes fall back to their Nanite fallback mesh rather than to an authored LOD chain. AI logging was on during capture, which adds a small constant cost to every reading.
I am looking for technical art work: pipeline tools, asset validation, optimisation passes and the systems that sit between art and engine. The work on this page is the direction I want to keep moving in. I also take environment art and level design work, and I am open to remote or to relocating.
olive.c.maxwell@gmail.com